
Introduction
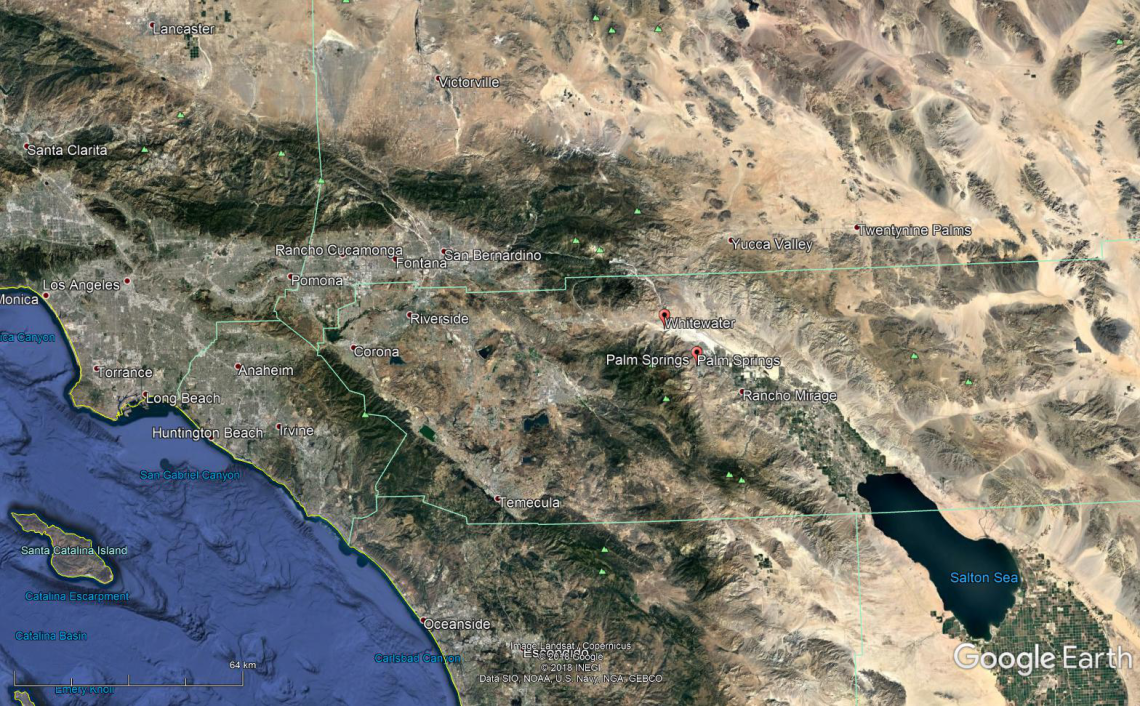
As a reader of this very confidential blog about the very confidential field of wind resource engineering, you may be familiar with the Palm Springs-Whitewater region in Southern California. This is where the first large scale deployment of modern wind turbines took place, in the early and mid-1980’s.
I will not make a detailed description of this wind-rush, there are thousands of webpages providing lenghtly details on the tax deduction mechanism and the later fate of the many manufacturers who took part in this adventure. See for instance this story.
Instead, I will focus on the work from a key employee of Aerovironment, Tom Zambrano, who kindly provided me with some extremely interesting reports about the specific wind resource studies for Southern California, but also more general on wind turbine siting methods. Tom worked for Aerovironment together with Peter Lissaman, and has contributed to the wind and site studies, and well as R&D activities there for about 30 years.

I first saw Tom’s name mentioned in a paper by Lissaman, presented at the Lyngby Symposium in 1980. As you may remember, I had ordered a bunch of old conference proceedings back in December, which I could not find on the web. I then received the proceedings from the Lyngby Symposium (see ToC here), which contains the following article by Lissaman, Zambrano and Walker: “Wind Energy Assessment of the Palm Springs-Whitewater Region“.
It sparked my interest because the study was carried out in 1978-1979, and appeared to me as the first of the kind so far in my genealogic quest. I could not find earlier studies having all characteristics of nowadays wind and site assessment:
- Commercial goal (producing a sound basis for siting and production estimates).
- “Nested scales” approach: regional, meso- and micro scales.
- Measurement campaign, including planning, validation, quality assurance and reporting.
- Site screening and GIS work.
- Production estimate including wake losses.
- Wind turbulence analysis and loads.
I then contacted Tom, who kindly sent me the full reports on which the paper is based, as well as a later report, also from Aerovironment, on a siting software they developed and commercialised. See below, those are the main documents I will be writing about in this post:
- (Lissaman, 1980): Wind Energy Assessment of the Palm Springs-Whitewater Region
- (Zambrano, Walker, Baker, 1980): Wind Energy Assessment of the Palm Springs-Whitewater Region
- (Zambrano, 1980): Assessing Local Wind Field with Instrumentation
- (Zambrano, 1981-1): Wind Energy Assessment Studies for Southern California vol 2 of 4
- (Zambrano, 1981-2): Wind Energy Assessment Studies for Southern California vol 3 of 4
- (Zambrano, 1981-3): Wind Energy Assessment Studies for Southern California vol 4 of 4
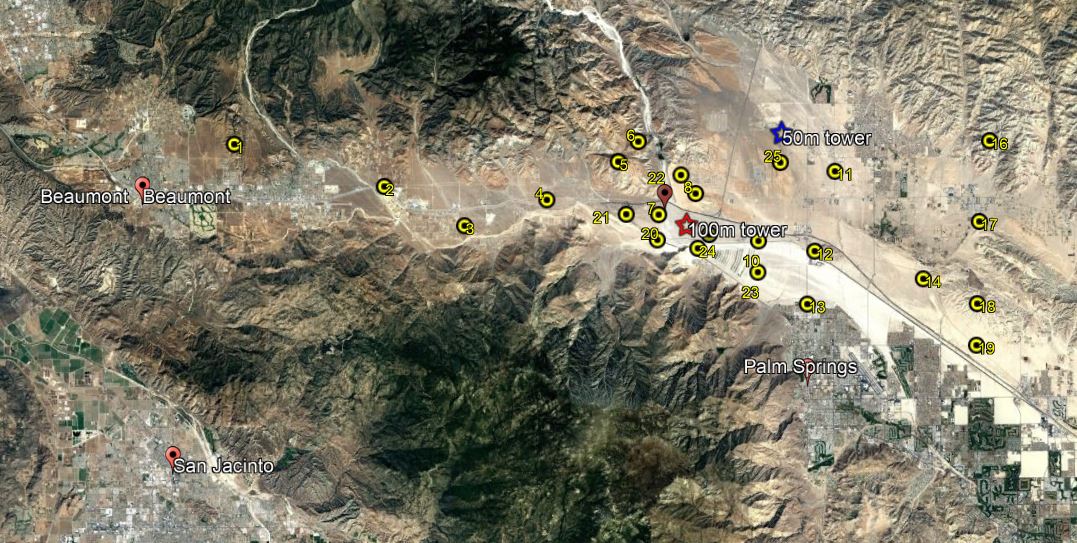
An outline of the Wind Resource Assessment analysis as viewed by Aerovironment is provided in Section 1 of (Zambrano, Walker, Baker, 1980):
Pasadena, California), March.
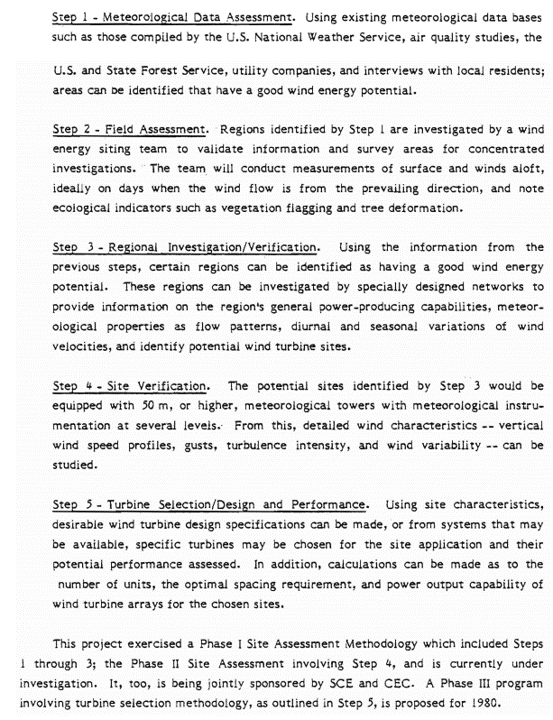
Btw, here a Google Earth image of the pass seen from the South-West, with the cities of Whitewater and Palmsprings in the background.
Field measurements
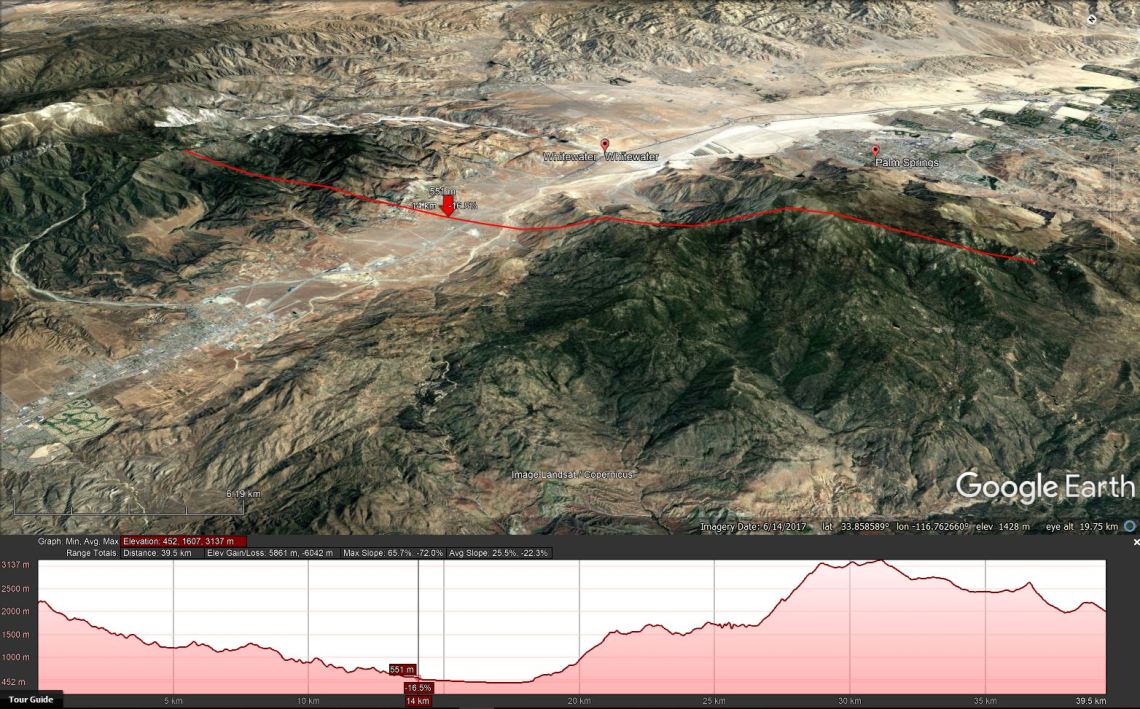
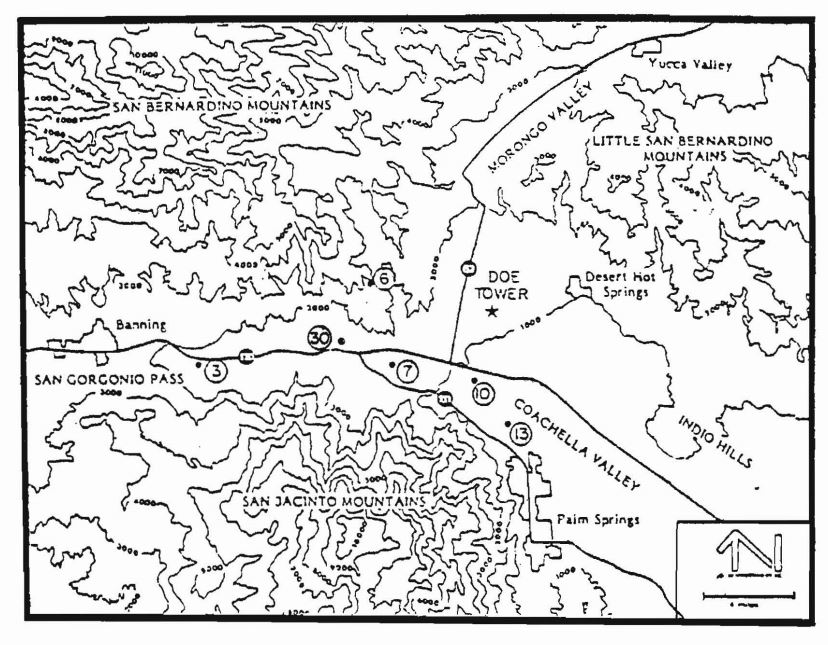
Based on a study of the wind-deformed vegetation across the area (more details on the method are in another report), as well as a short measurement series of hand-held measurements at many locations (32), 19 sites were chosen for a detailed field campaign, using 10m masts, see below in yellow:
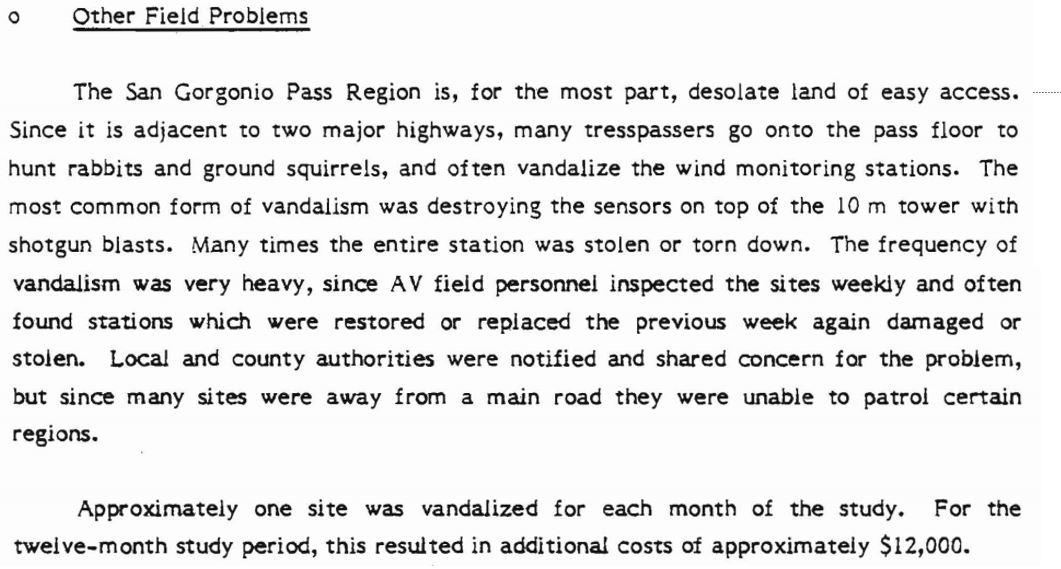
The 1980 report contains a detailed description of the measurement system, including drawings of the mast and anemometers. Apart of the regular hardware failure issues, vandalism turned out to be a serious issue:
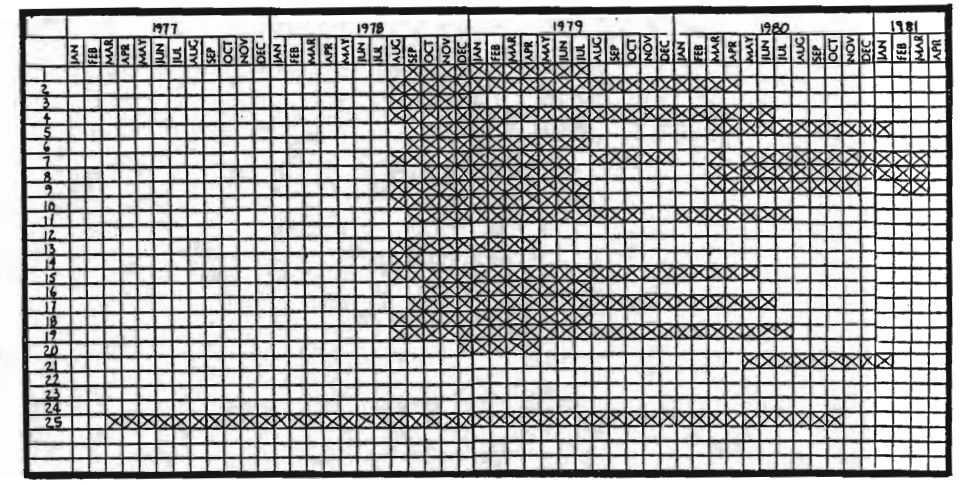
Additional campaign were carried out in 1980-1981, and overall at least a year of data was recovered at the sites, see below.
Long term and vertical extrapolation (the planned hub height of the MOD-2 turbines was about 200 ft) was carried out by using:
- The nearby measurements from the Banning airport: see page 3-21 of (Zambrano et al., 1980) where the variance ratio method is mentioned.
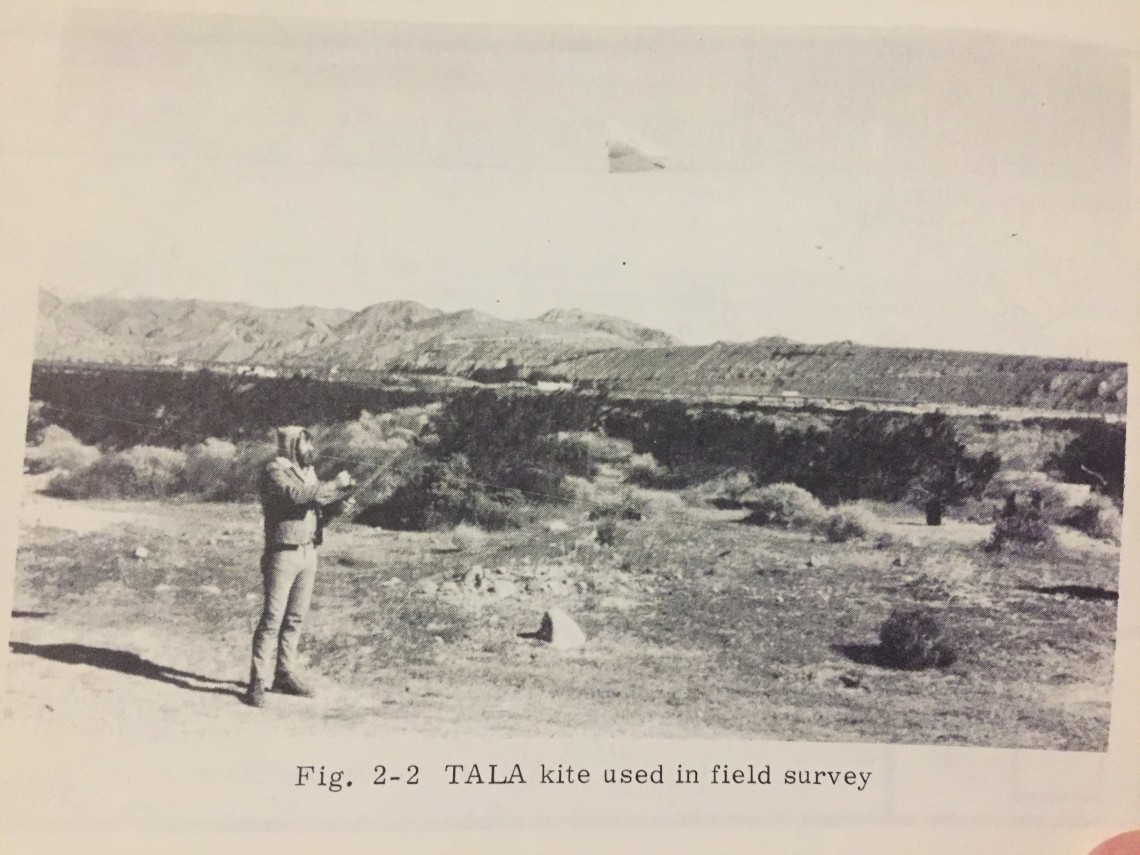
- Wind speed measurements using Tethered Aerodynamically L.ifting Anemometer (TALA), which Aerovironment used in other places as well.
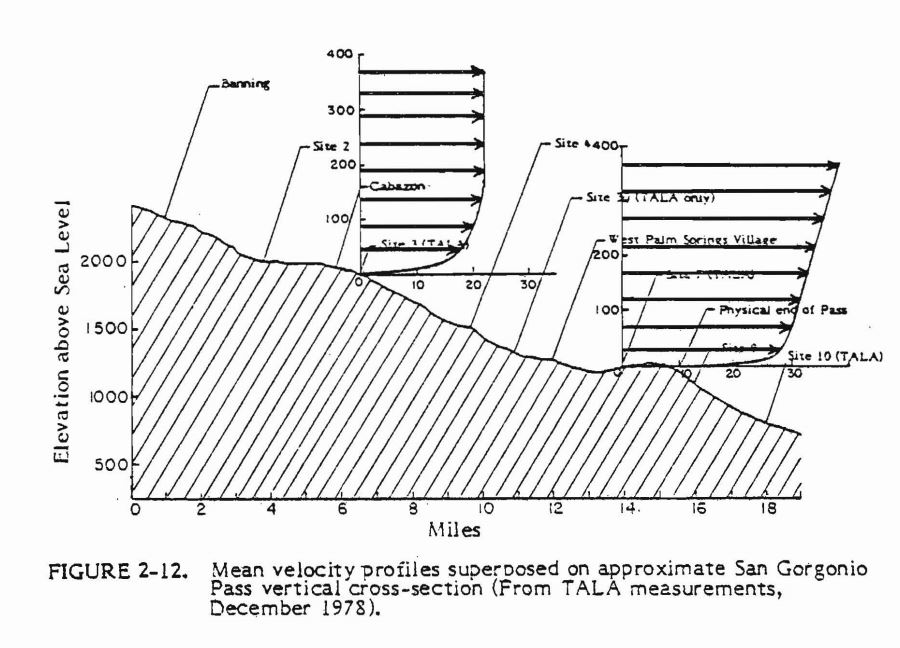
Using only 10m masts was a known limitation of the study for the authors of the report, who attempted to map the orography- and stability-driven flow pattern at the measurement locations, using the kites. See below a picture of a kite operator, as well as measurement results together with orography.
The data were processed in various ways, that are very similar to what we would do today, that is:
- wind speed- and direction joint occurence tables
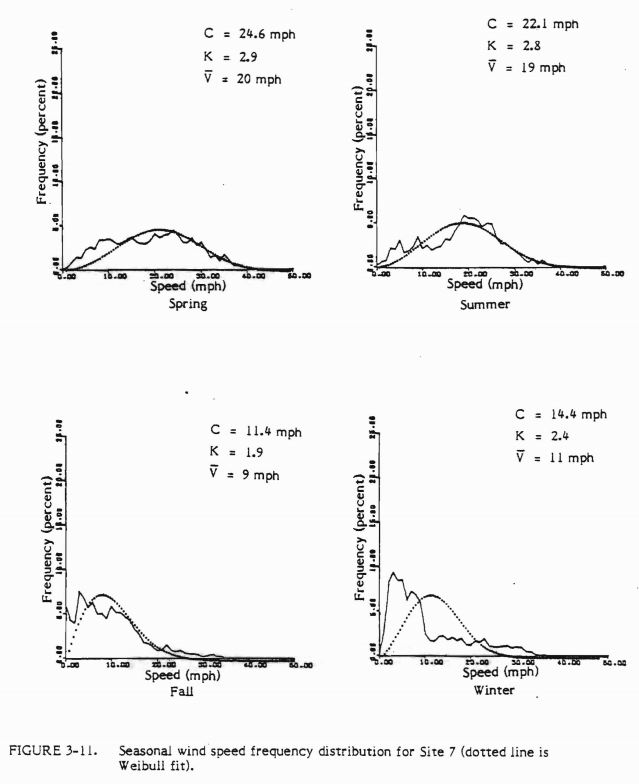
- histograms and wind speed distribution weibull fits
- wind roses
- diurnal and monthly variations
See below an example:
Site selection
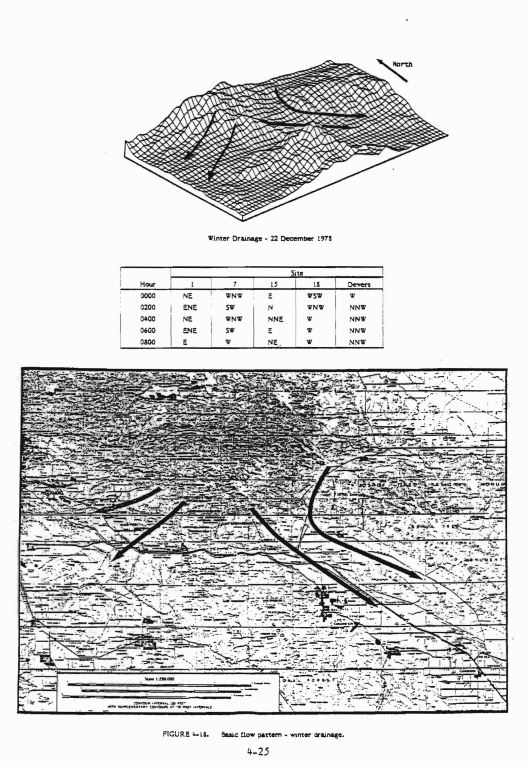
Orography and the seasonal synoptic patterns are the main drivers behind the variation in wind climate at this site. Using the data gathered over a year, as well as by making a nice and elegant description of the wind patterns at the site (see illustration below), several wind classes areas were defined for the region.
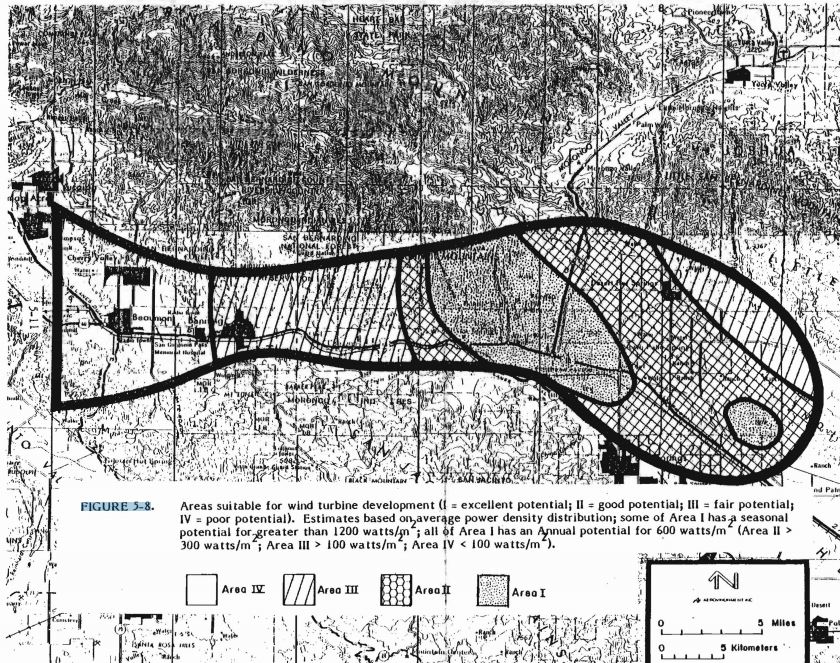
Eventually, the wind classes are plotted onto a map, which identifies clearly the Whitewater area as the windiest.
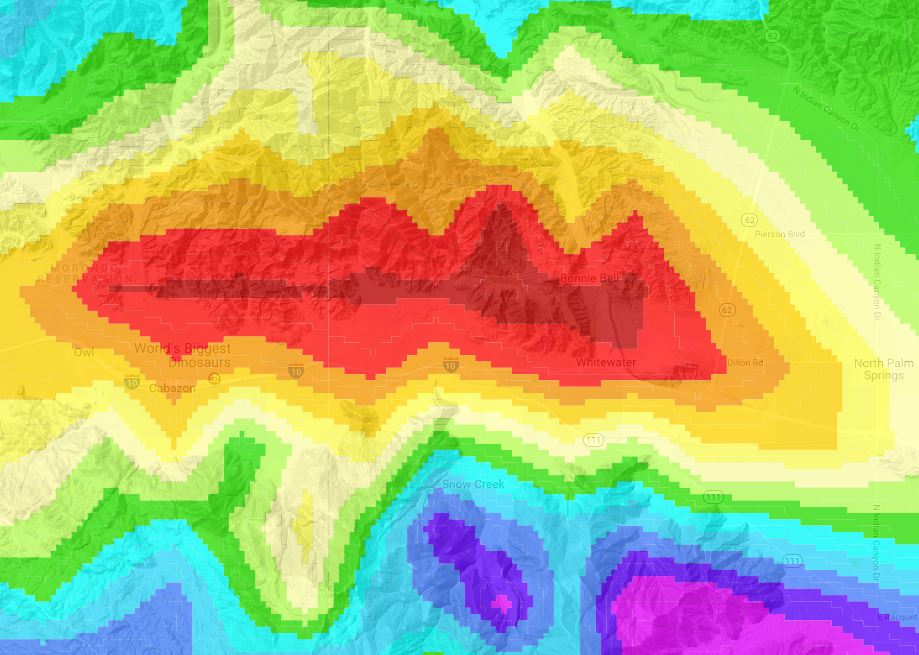
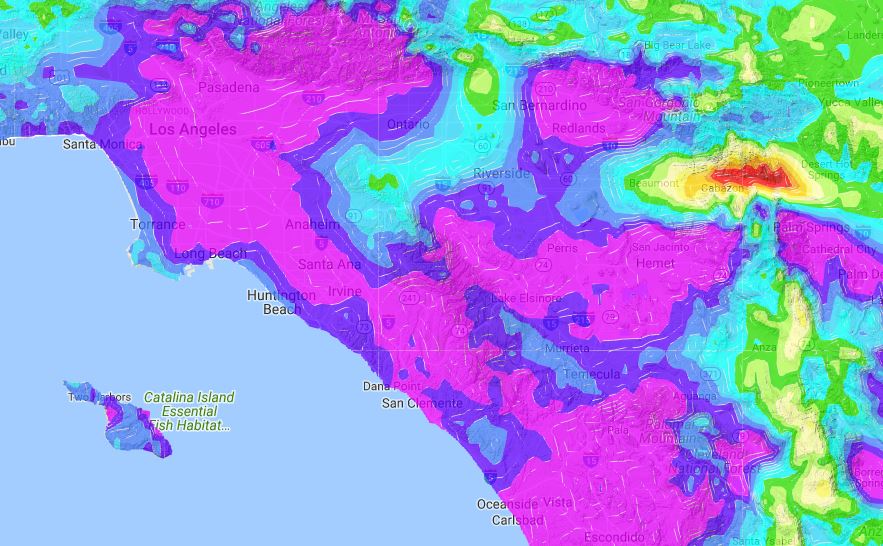
On the high-level wind maps available today, see for example below the NREL Wind Prospector at 80m AGL, the region still appears to be the windiest, so well done (once more) Aerovironment :):).
Some high-level calculations of array efficiencies are carried out using the Lissaman model. Follows an elegant and concise description of the issues related to aeroelastic modelling in atmospheric turbulence.
Context, and my personal thoughts
Using the Timeline, one can retrieve a couple of wind resource and siting reports published around the same time, however with major differences:
- The Danish Wind Atlas: it updates a measurement database collected in the mid-50’s and early 60’s, and makes mostly use of roughness changes model, while providing the basics of the WAsP model (without orography model, Denmark being what it is… flat..)
- The first assessment of the Bristish offshore wind ressource, at the 2nd BWEA workshop in 1980. I will make a seperate post on this study, it does not contain the same level of details as the one from Aerovironment here.
As I wrote earlier, I had not seen such a detailed commercial field study before 1980 before I received the reports from Tom. The level of detail in the reporting, and the extent of the measurement campaign is impressive. I am happy to be able to share those.
Much is to be written about the parallell developments of wind resource studies in the US and in Europe, I will try to provide my views on it in the next post, which will focus on the siting software from Aeovironment, and how it compared with WasP from Risø-DTU.
Comments and/or suggestions are always welcome,
Rémi
1 Comment
Comments are closed.